... and used Foxglove through the journey
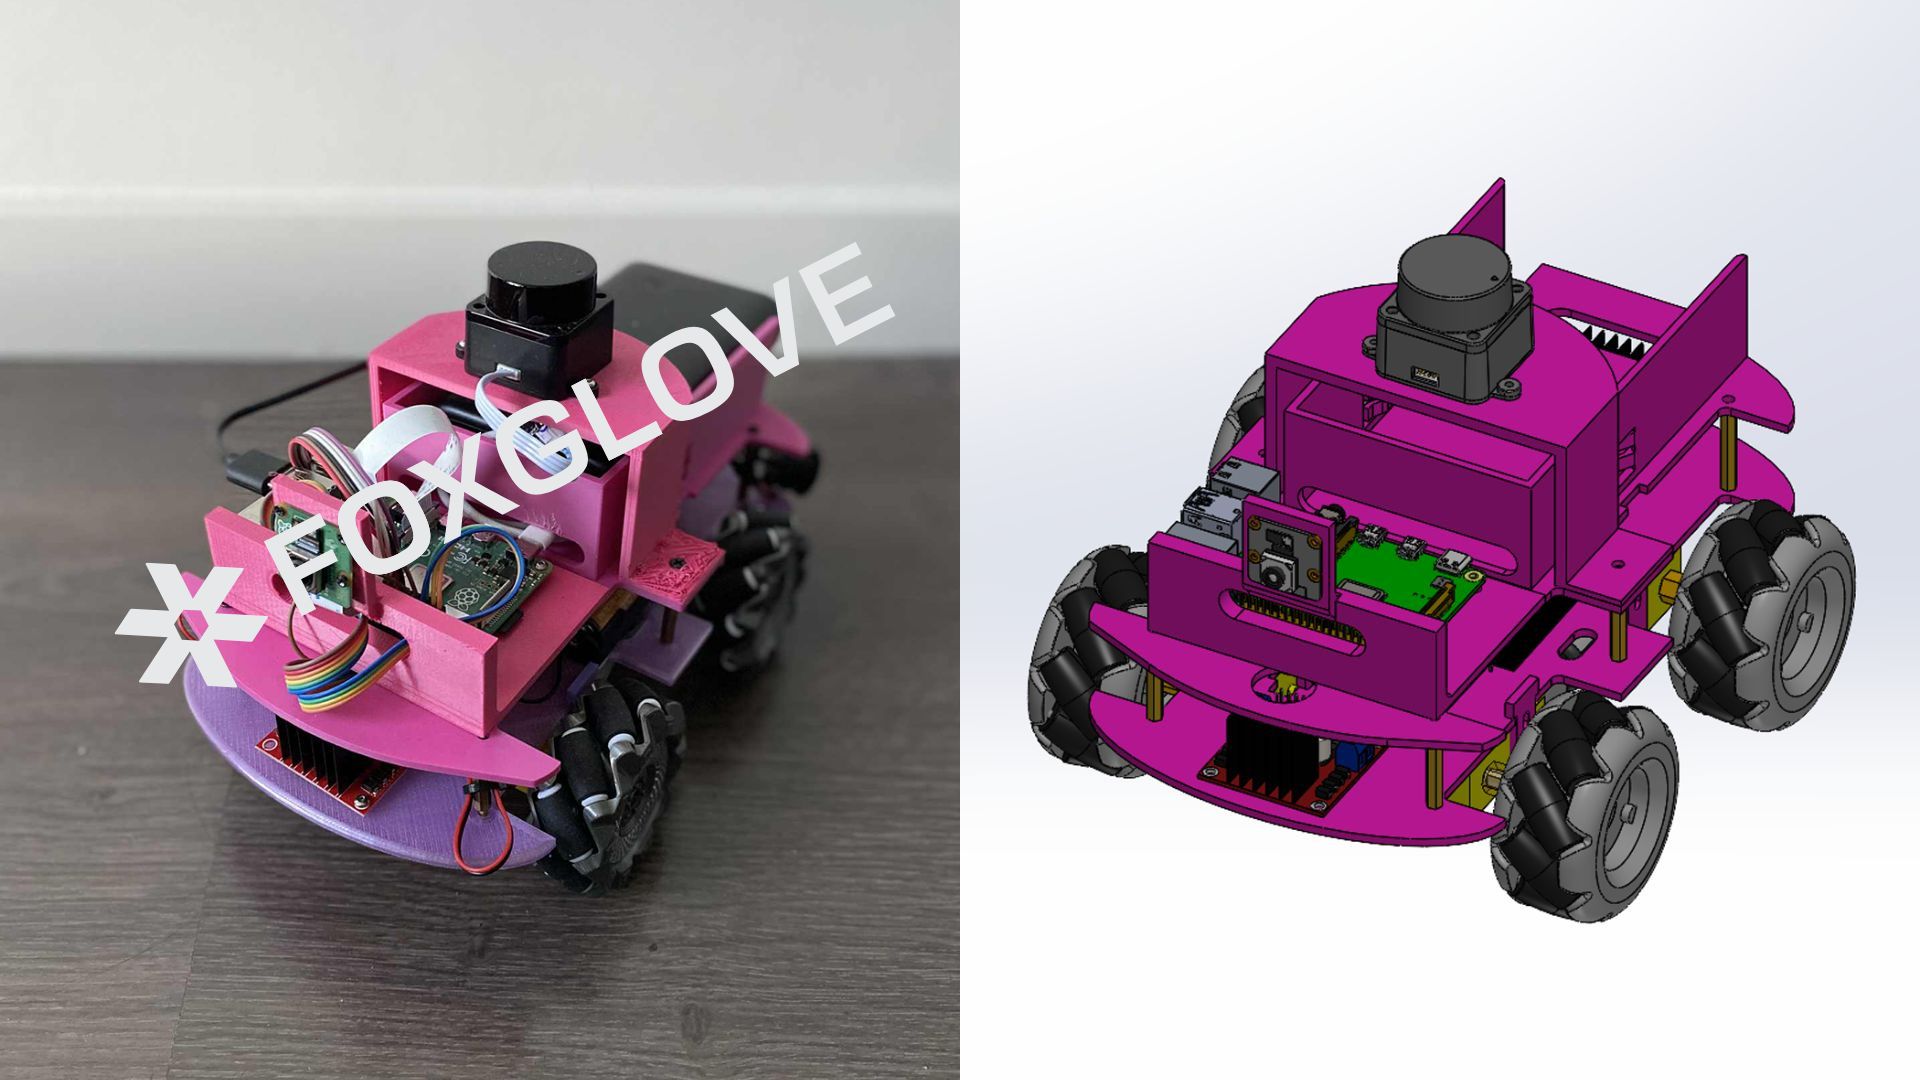
This article is a continuation of the previous one Just1: How I built a small autonomous robot …
.
I am in no way affiliated with Foxglove, and this article only reflects my personal experience.
The Problem: Visualizing Robot Data
When building autonomous robots, you’re dealing with a constant stream of data from multiple sensors: lidar scans, camera feeds, IMU readings, motor commands, and navigation states. The challenge isn’t just collecting this data. It’s making sense of it all in real-time.
You can easily spend more time debugging visualization tools than actually working on your robot’s algorithms.
Traditional approaches to visualize your data in robotics usually include:
- Command-line tools: Functional but not intuitive for complex data
- Custom web interfaces: Time-consuming to build and maintain
- Python/Jupyter: Flexible and fast to iterate, but mostly offline and manual
- ROS2 built-in tools (Rviz): Powerful but with a steep learning curve and ugly UI
Enter Foxglove
Foxglove is a powerful robotics visualization tool that works seamlessly with ROS2. It’s like having a professional-grade cockpit for your robot, but without the months of development time.
What Makes Foxglove Special
Real-time Data Visualization: Foxglove connects directly to your robot’s ROS2 topics and displays sensor data in real-time. Whether it’s lidar point clouds, camera feeds, or navigation paths, everything updates live as your robot operates.
Multi-Panel Interface: Unlike single-purpose tools, Foxglove lets you create custom dashboards with multiple panels. You can have a 3D map, camera feed, sensor graphs, and control panels all in one view.
No Coding Required: The interface is drag-and-drop. You add panels, configure them, and start visualizing immediately. No need to write custom visualization code.
Recording and Playback: You can record all your robot’s data and replay it later for analysis. This is invaluable for debugging issues that happened hours ago.
How I Used Foxglove with Just1
For my Just1 robot project, Foxglove became the central hub for development and testing. Here’s how I used it:
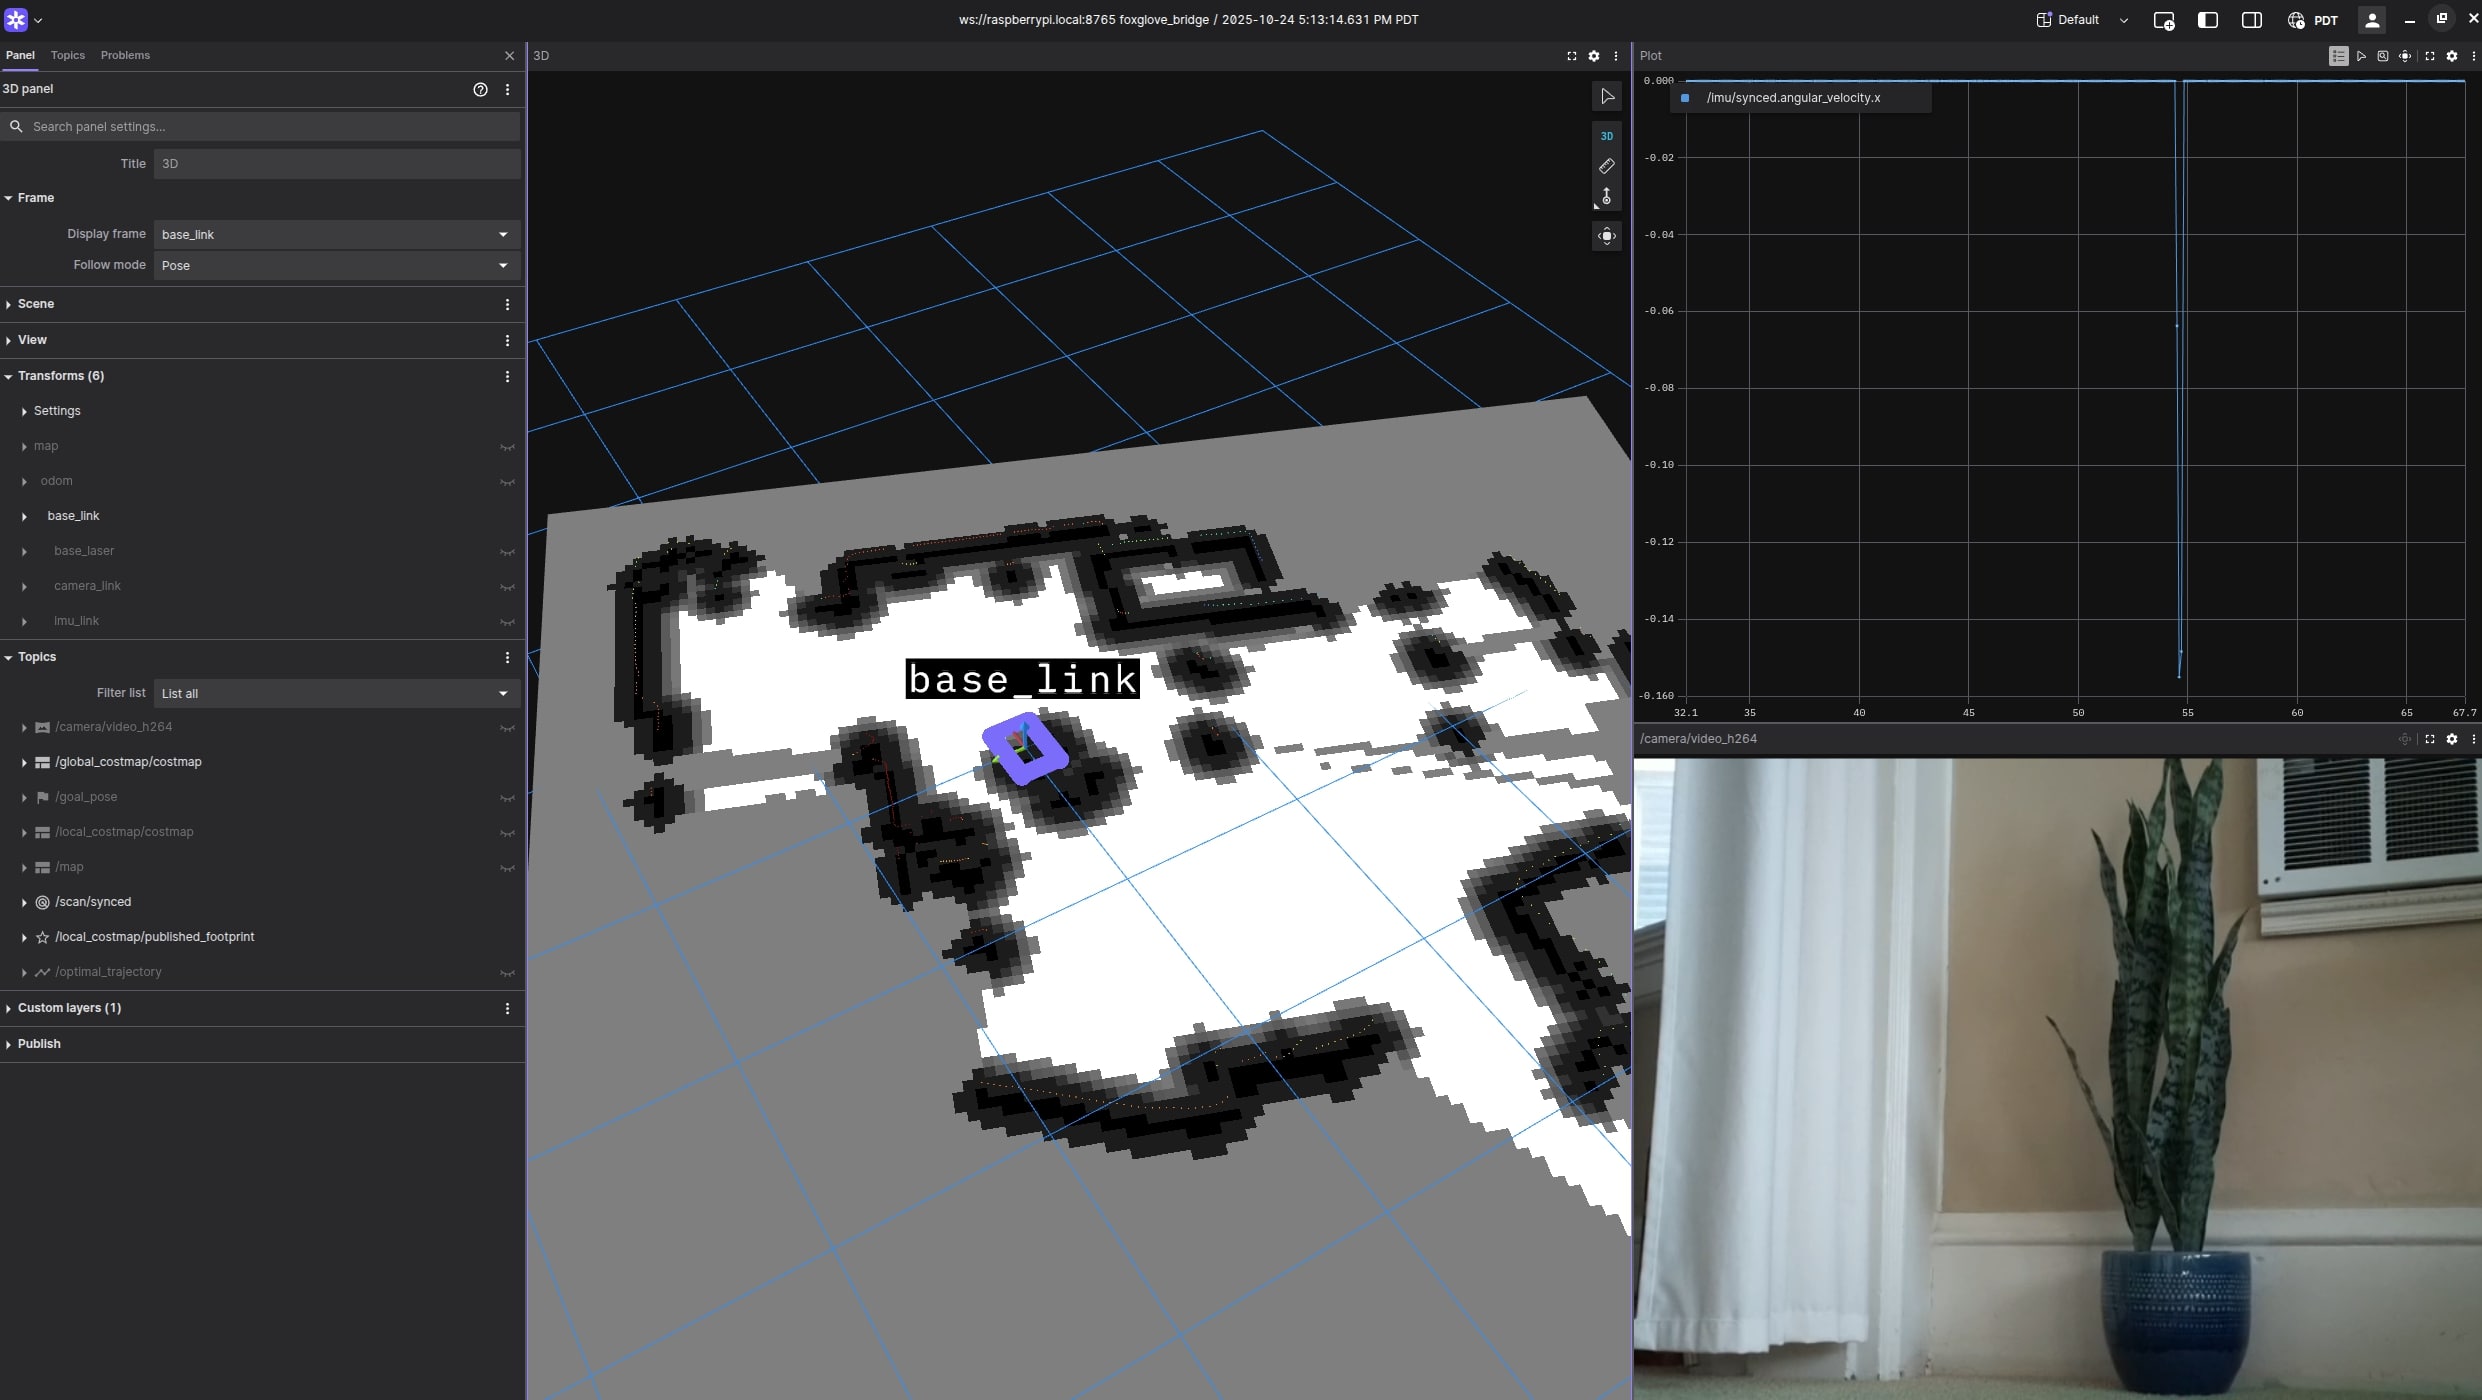
1. Real-Time Monitoring
- 3D Map Panel: Visualizes the robot’s SLAM map and current position
- Camera Panel: Shows the camera feed for visual feedback
- Plot Panel: Displays sensor data like IMU readings and motor speeds
2. Navigation Control
- 2D Pose Panel: Click on the map to send navigation goals
- Path Visualization: See the planned path and current trajectory
- Obstacle Detection: Monitor lidar data for obstacle avoidance
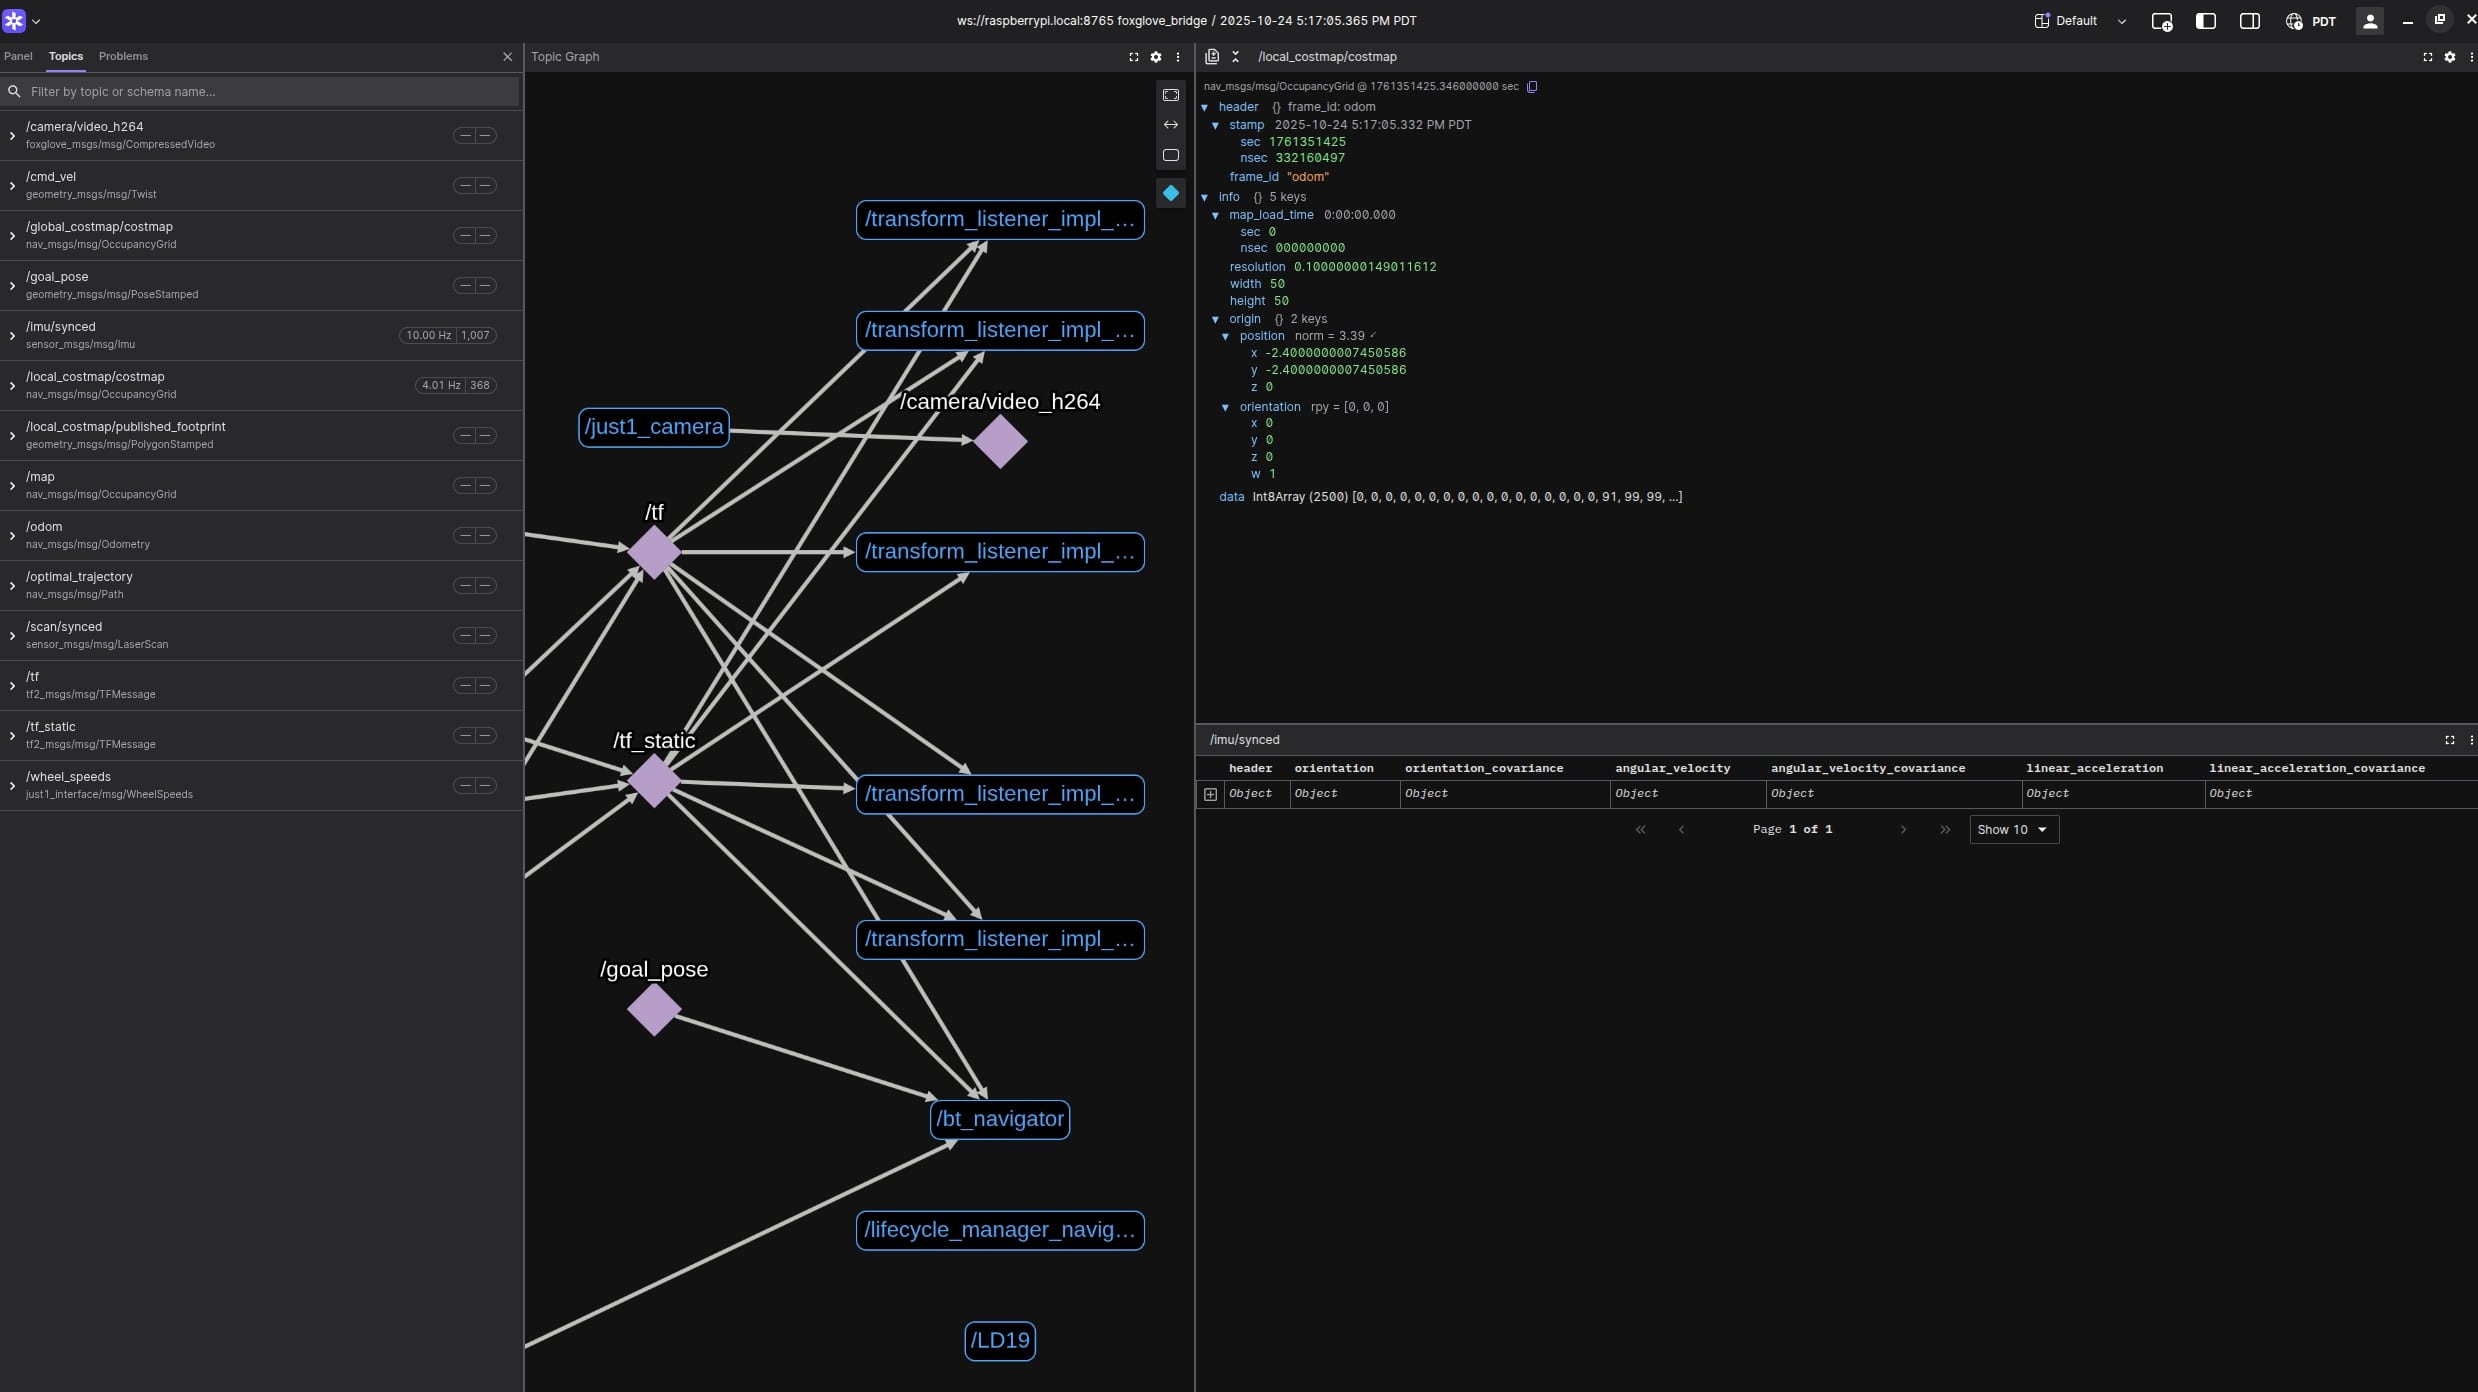
3. Debugging and Analysis
- Topic Monitor: Track all ROS2 topics and their message rates
- Log Analysis: Review recorded data to understand what went wrong
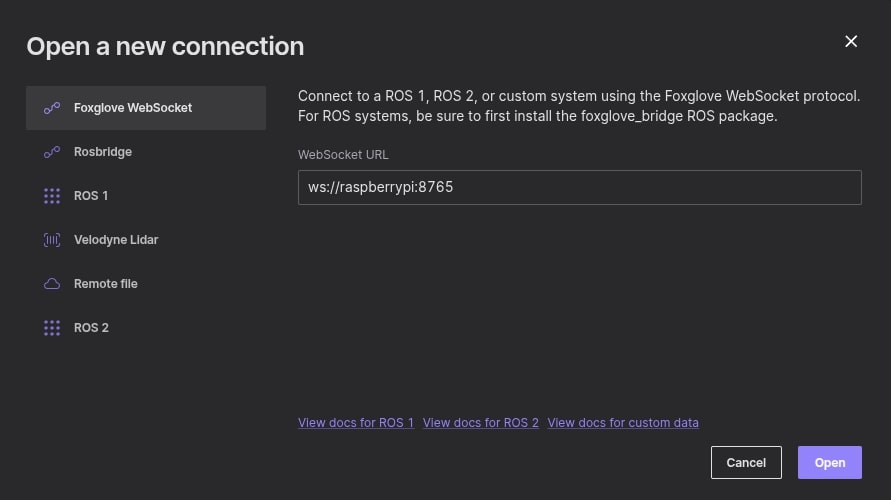
How I installed it
There are many ways to connect Foxglove to your robot depending on your stack. In my case, since I was using ROS2, it was as simple as adding another node. I followed their documentation here
.
Check out my code here
where I add the foxglove-bridge node.
You can whitelist a list of topics and data will start flowing into your Foxglove app.
Want to add a Camera Panel? Just send over your /camera/video topic.
Installing the UI on your computer is even easier. Just download Foxglove and follow the steps here again .
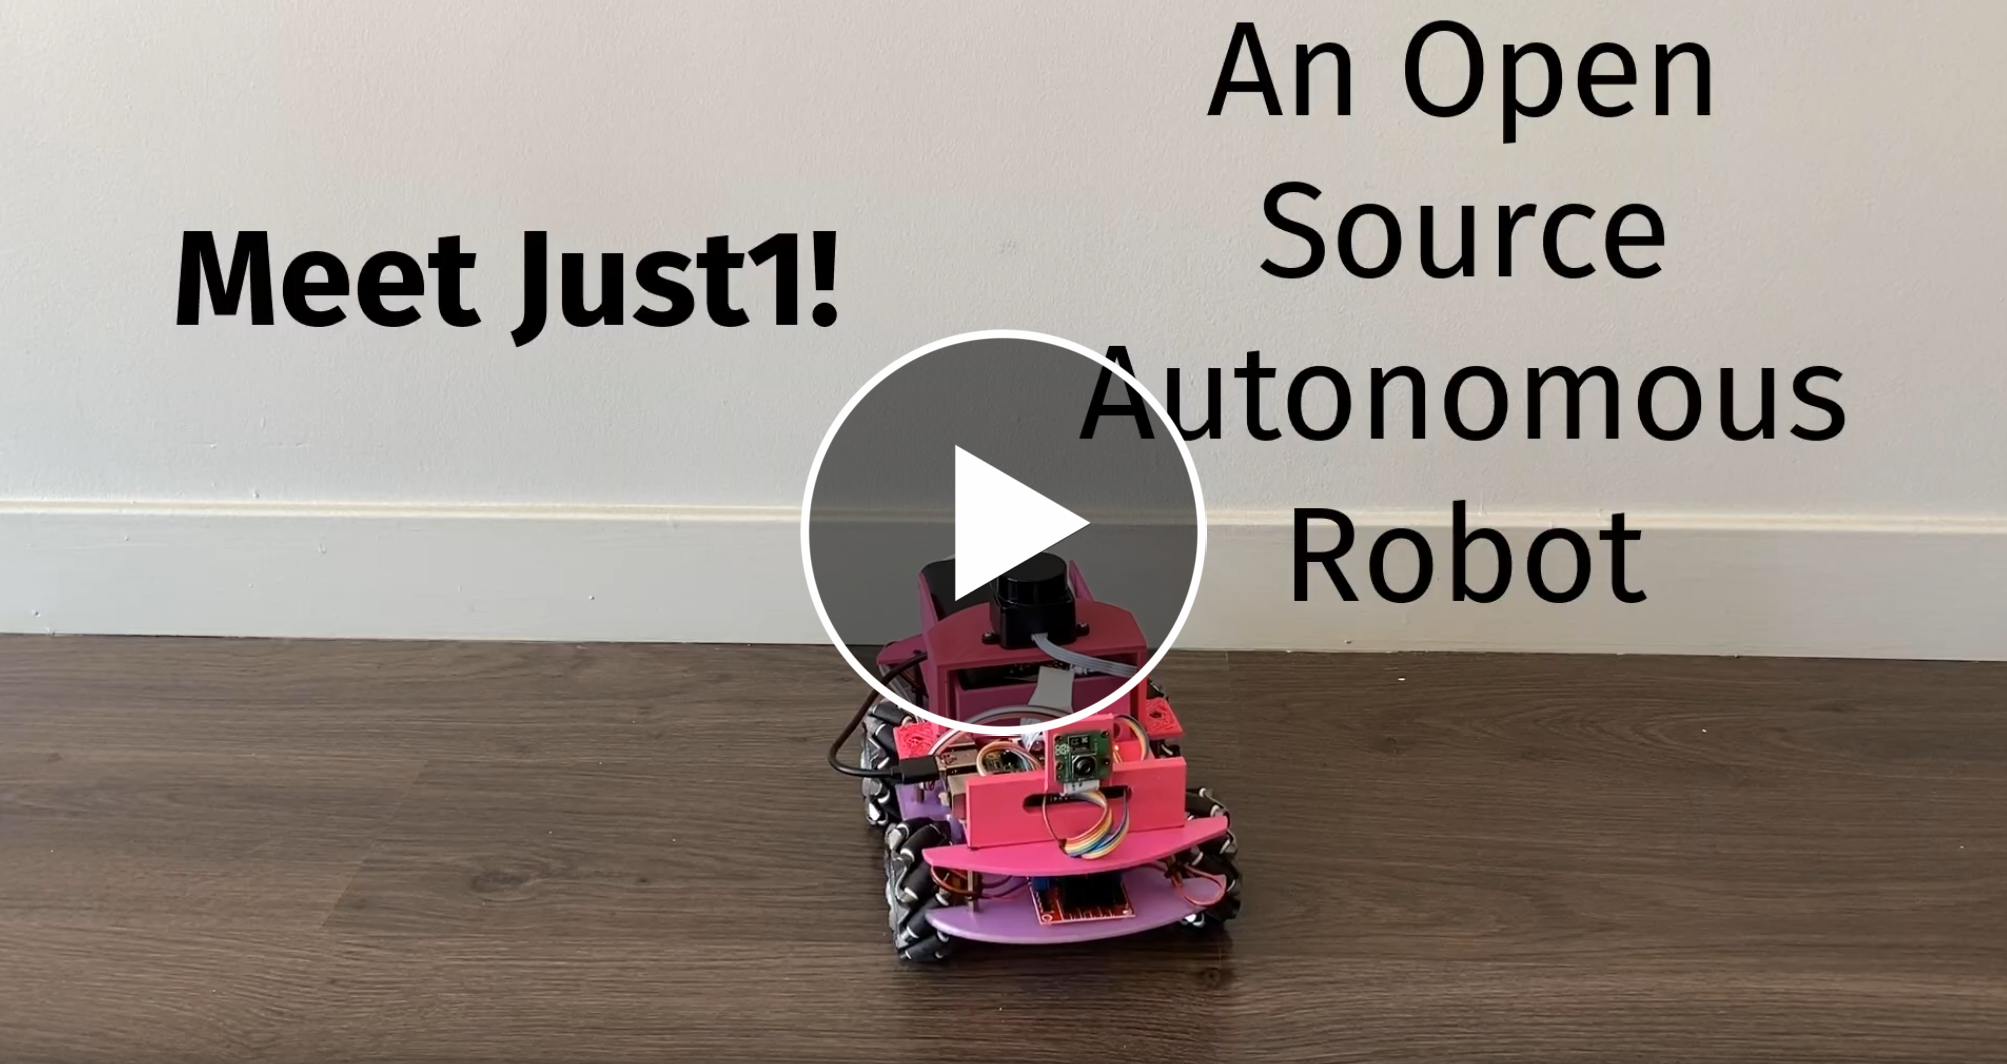
See Foxglove in Action with My Just1 Demo
The Takeaway
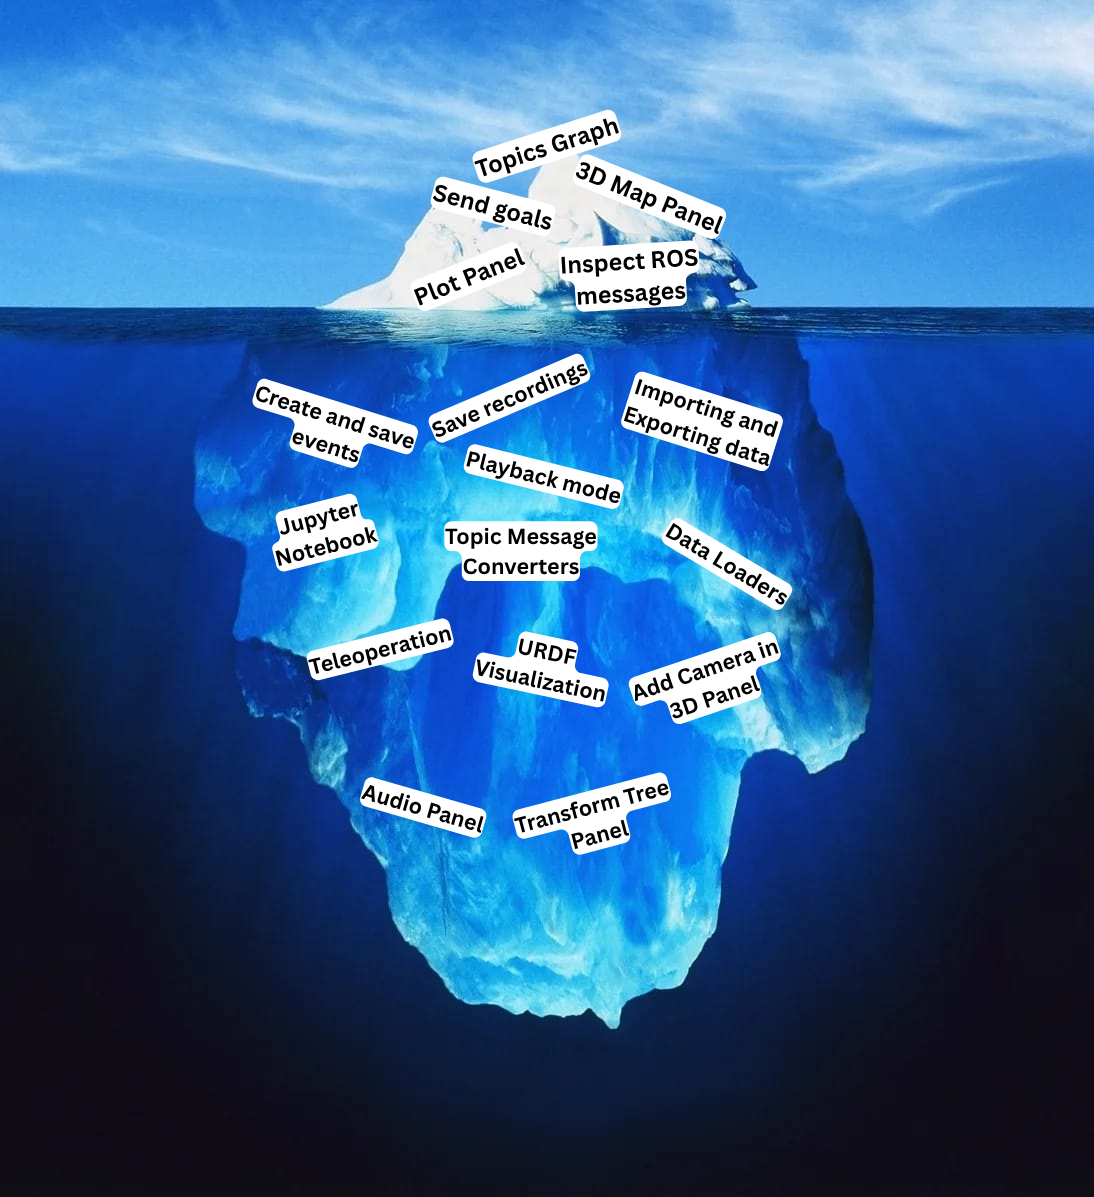
Foxglove Studio transformed my robotics development from a frustrating, guesswork-heavy process into an intuitive, visual experience. It’s not just a tool. It’s a paradigm shift in how we interact with robot data.
The features I explored through the Just1 project only seem like the tip of the iceberg of what Foxglove can do, and I’m looking forward to experimenting more with it in future projects.